UCLA Data Science 102
Read →
2023
Github: https://github.com/mingeon21/KBO
Graphical model: https://mingeonkim.ngrok.io/status/statistics/
Prediction model: https://mingeonkim.ngrok.io/status/ml/
I am deeply passionate about baseball and the rich analytical insights that statistical data can offer to enhance the experience of the sport. My project aims to harness the wealth of baseball statistics from the Korean Baseball Association over the past two decades. With this extensive data set, I plan to develop machine learning algorithms that can predict a player's performance both on a daily and annual scale.

During my younger years, I participated in various sports, from soccer and basketball to baseball. While each sport had its charm, baseball uniquely captivated me. Unlike the straightforward metrics in other games, baseball offered an intricate web of statistics for every player. This complexity initially posed a challenge, but as I delved deeper, it transformed my view of the sport. The intricate stats painted a detailed picture, revealing the true calibre of each player. Driven by this newfound passion, I began to craft my own player predictions, game by game, season by season, immersing myself in the world of baseball analytics. However, I observed a declining enthusiasm for the Korean Baseball League. Recognizing an opportunity, I was inspired to adopt methodologies from popular U.S. baseball prediction websites. My aim? To reignite the passion of Korean baseball fans by introducing them to the enthralling realm of baseball predictions.
This project is tailored for Korean Baseball enthusiasts, both seasoned fans and those just beginning their journey into the sport. By harnessing the power of statistical predictions, we offer fans a clearer understanding of the unfolding dynamics on the field. This initiative not only enhances viewers' experience but also revolutionizes the way they perceive and engage with baseball, making its intricate statistics more accessible and captivating.
I first began to scrap sets of the past 20 years of pitching data from the official KBO statistics website for the raw sets of baseball statistics for my machine-learning algorithm. Initially, I planned on copying and pasting the entire 20 years' worth of statistics into a single CSV file, but I recognized that by splitting the data into each year, I would be able to show the trends of each statistical value’s changes throughout different years of baseball seasons.
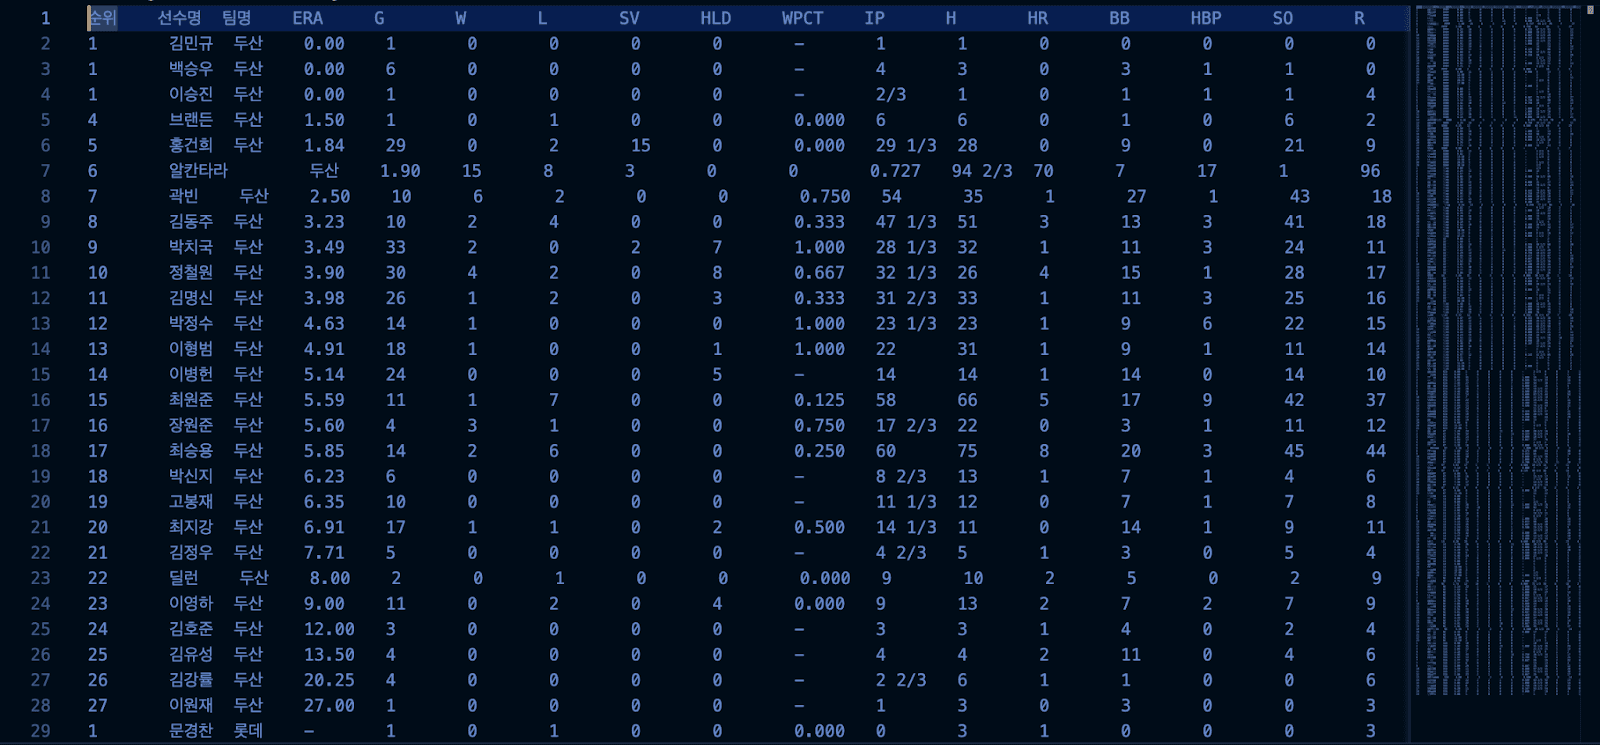
(Example of the CSV file for the 2023 season statistics)
Hence, I have copied and pasted each year’s pitching statistics into individual CSV files, organized in a convenient form to be utilized for comprehensive 20-year analysis and prediction, and also be used for yearly analysis purposes.
Observing through the organized sets of data, I realized that there were some flaws regarding the data sets. Regarding some statistical values, especially ERA (earned run average), there were some that were left with a hyphen due to the player’s incalculable ERA value (i.e. throwing 0 innings then allowing a run, which equals an ERA of infinity). Simply accounting for those hyphen values as infinity will create a huge inaccuracy in the prediction model, as it will bring the average ERA of the pitchers of that season to an incalculable amount. Hence, I needed to treat this outlier by re-assigning such values with an edited statistical value, yet a high enough value to account for the player’s high ERA value. Considering the ERA values of other pitchers, I have decided that an alteration to an ERA of ‘100’ would provide the most accurate change for my prediction model. Therefore, I have created the function ‘checkForMinus’, which scans through the entire data sets to search for any string of ‘-’, then converts those values into an integer value of 100.

Moreover, another flaw was seen in the ‘IP’ column of the data set, as when copied and pasted from the KBO website, some values were included ‘/’, which indicated a fractional value, as ⅓ of an inning account for a single out in an inning. Hence, they were converted as a string onto a data set. Those fraction values needed to be modified into an integer to be interpreted by the machine learning model. Because ⅓ could be interpreted into an integer value of 0.33 and ⅔ could be interpreted into an integer value of 0.66, I have established another function, ‘stringTo Float’, to search for those string values, then converting those values into the according integer values.
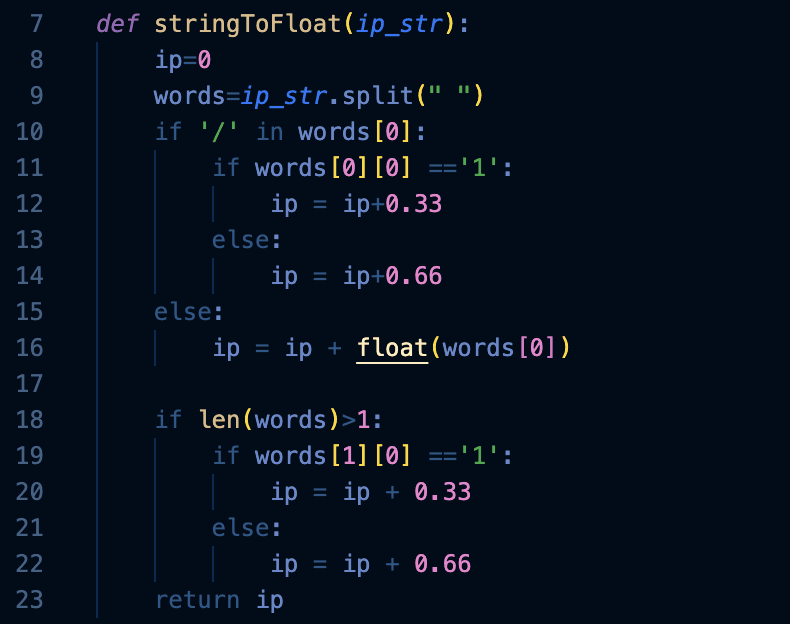
After finalizing my data sets, I initiated an actual training function for the machine learning model. The function first gathers all 20 years of CSV data files into a variable called ‘df_all_years’. Then, using the ‘stringToFloat’ and ‘checkForMinus’, I preprocessed the data set to be interpreted by the machine learning model. After data became ready to be calculated by the machine learning model, I then called upon linear regression to finally train the machine learning model with my 20-year data sets.
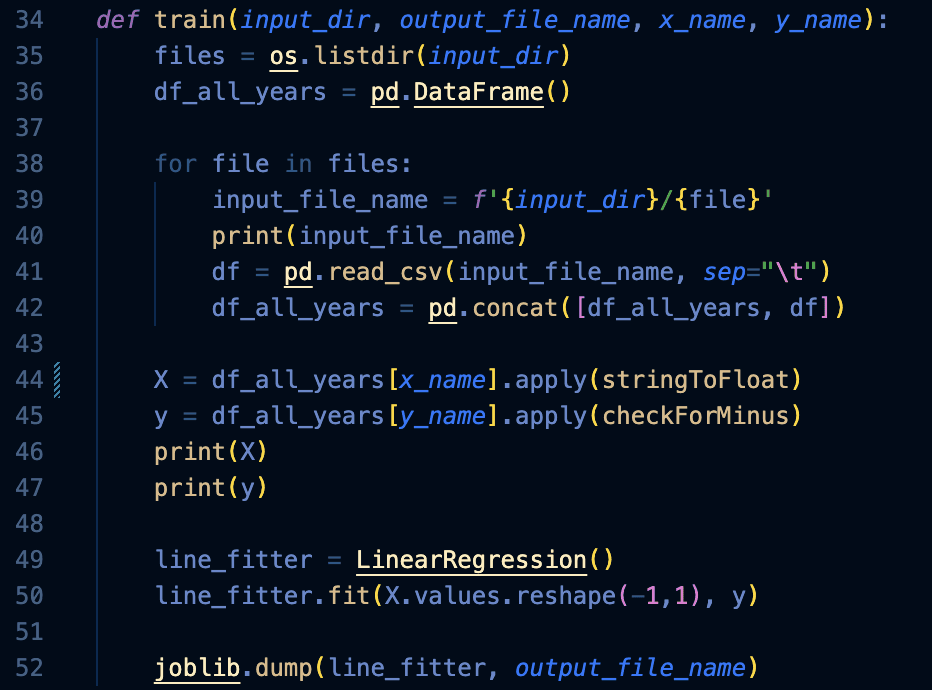
Finally, the ‘main’ function executes the ‘train’ function, accessing the already trained machine learning model, ‘joblib’ to provide the prediction y value to the user’s inputted x value. Due to the time and skill restrictions, I was only able to confine to a chosen x and y value, which were IP (x value) and ERA (y value), as those are the most common correlations drawn in baseball statistics.

Moving on from data training and prediction models, I created a new file to create Python functions that take HTTP requests and returns HTTP response. First, I needed to create a function that calls on joblib, then use the trained model to make a prediction of the y value (ERA), according to the user’s x value. Accordingly, I used the variables, ‘model_era’ and ‘model_whip’ to access joblib. I decided to add another y-value statistic, WHIP, as it is another commonly made comparison between the innings pitched. After accessing joblib, I created an another set of variables, ‘predict_era’ and ‘predict_whip’ to assign them with the predicted values from joblib, then return the value back to the users.

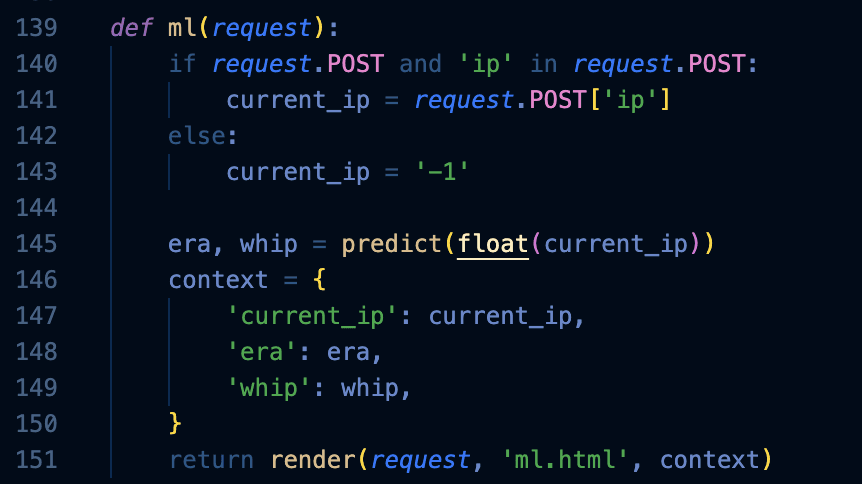
Furthermore, the ‘ml’ function detects the user’s new input into the application using ‘request.POST’, then renders the program to calculate the prediction value using the user’s new input. Using the ‘predict’ function, the application will return the predicted ERA and WHIP values back to the users.
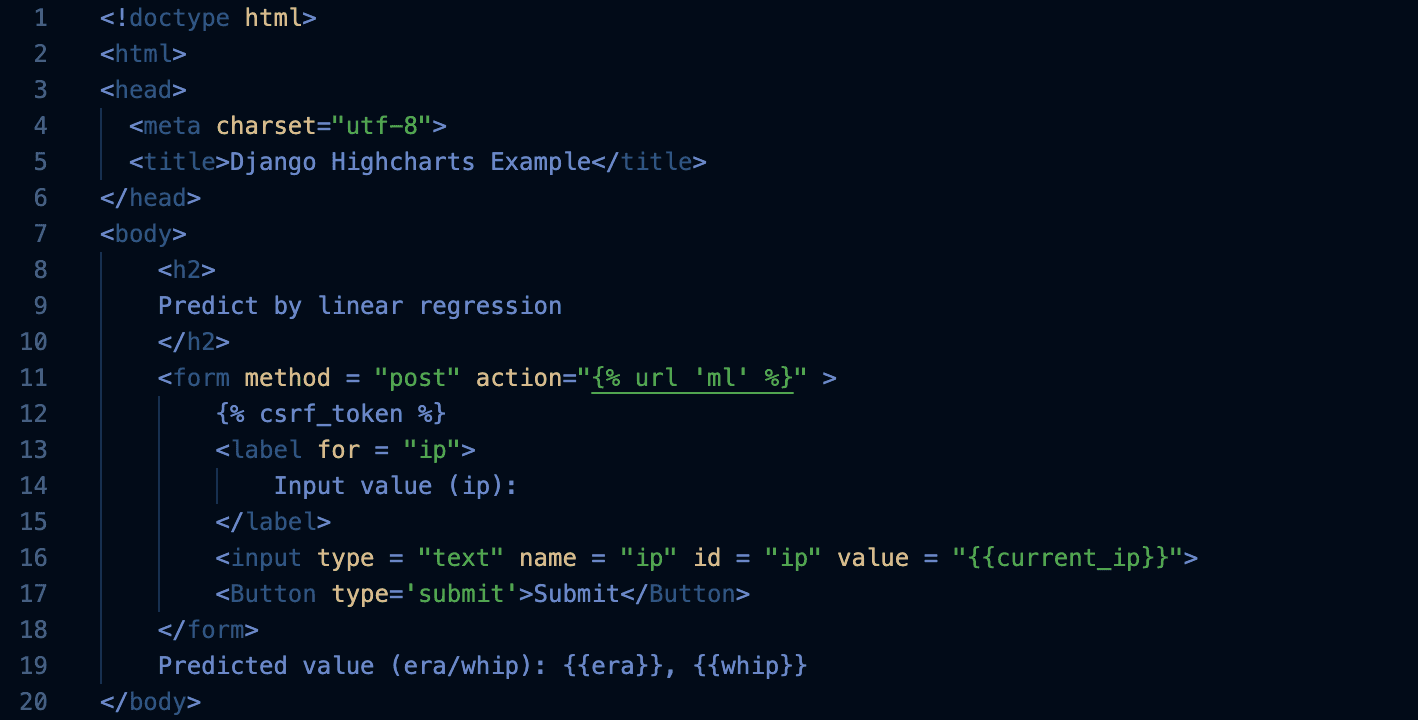
Finally, I have created an according HTML model to facilitate and create the structure of my application. I have created the title ‘Predict by linear regression’, then a section for the users to input their IP values. Then after the user value is inputted and processed through the functions, the predicted values will be displayed underneath the input section, with the subheading: ‘Predicted value (era/whip).
Final model:
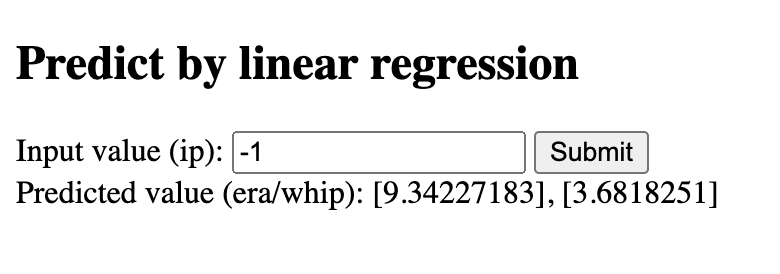
(Machine Learning Prediction Application)
Although the creation of the prediction application was over, I felt that my application needed more visual features to attract newer audiences to be interested in the statistics of baseball and my application. Hence, I have decided to add a graphical model that depicts the chosen x and y statistical values in a graph, which will show the general correlation between the 2 chosen statistical values. Moreover, I thought that the application would have more intriguing detail if there was a separate section where the player with the highest and the lowest value of the chosen statistical values.
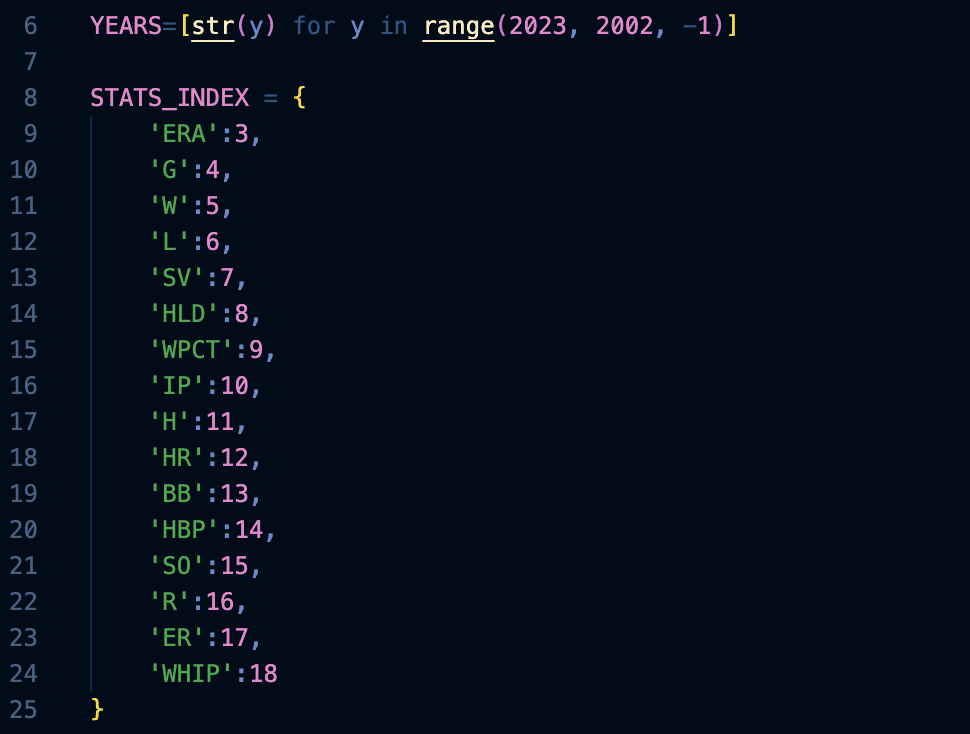
I first created 2 arrays, ‘YEARS’ and ‘STATS_INDEX’ that will be used as a header in which the users could choose the year of the data and the 2 baseball statistics to be used as a x and y values to be displayed in the graph.
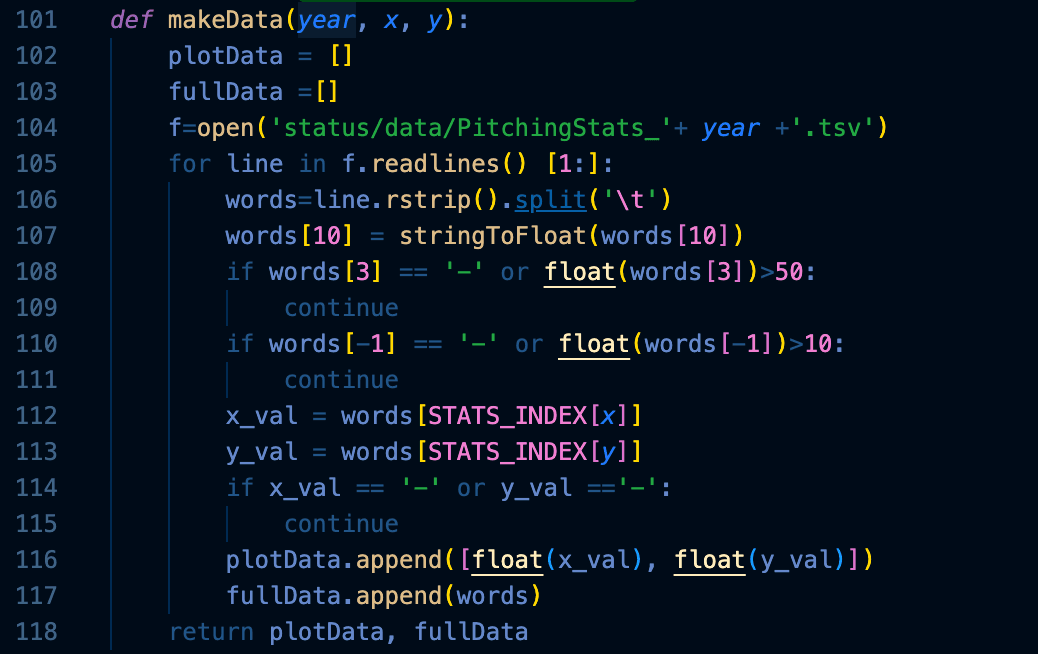
Similar to the process I have taken to organize the database in a way for the machine learning model to understand, I need to repeat a similar process to create a graph using the CSV data files. I created two arrays, ‘plotData’ and ‘fullData’. ‘plotData’ saves only the statistical data that has been chosen by the users to be plotted in the x and y-axis. ‘fullData’ saves data that will be put towards minimum and maximum value section. Another variable, ‘words’ is used to preprocess the dataset by storing after splitting based on tabs. Overall, the ‘makeData’ function prepares the needed data for the plotting of the graph.
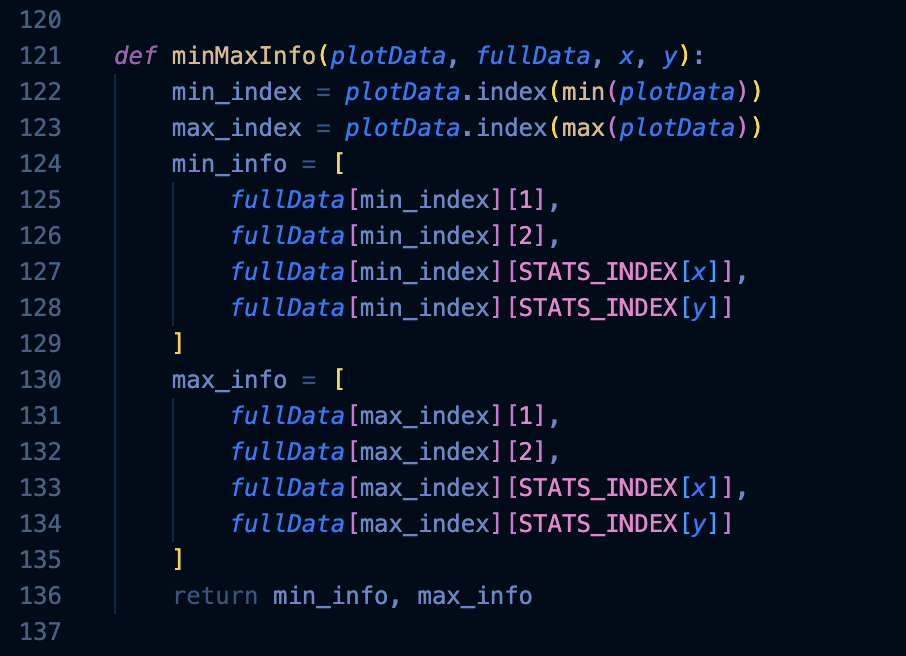
In the ‘minMaxInfo’ function, it uses the data selected from the ‘plotData’ function to determine the minimum and the maximum value from the data set, then saves it to the variables ‘min_index’ and ‘max_index’. Then, arrays ‘min_info’ and ‘max_info’ are created, saving the necessary data that will be needed to be included in the min and max application, such as player name, team name, and the player’s x-axis and y-axis statistics values.
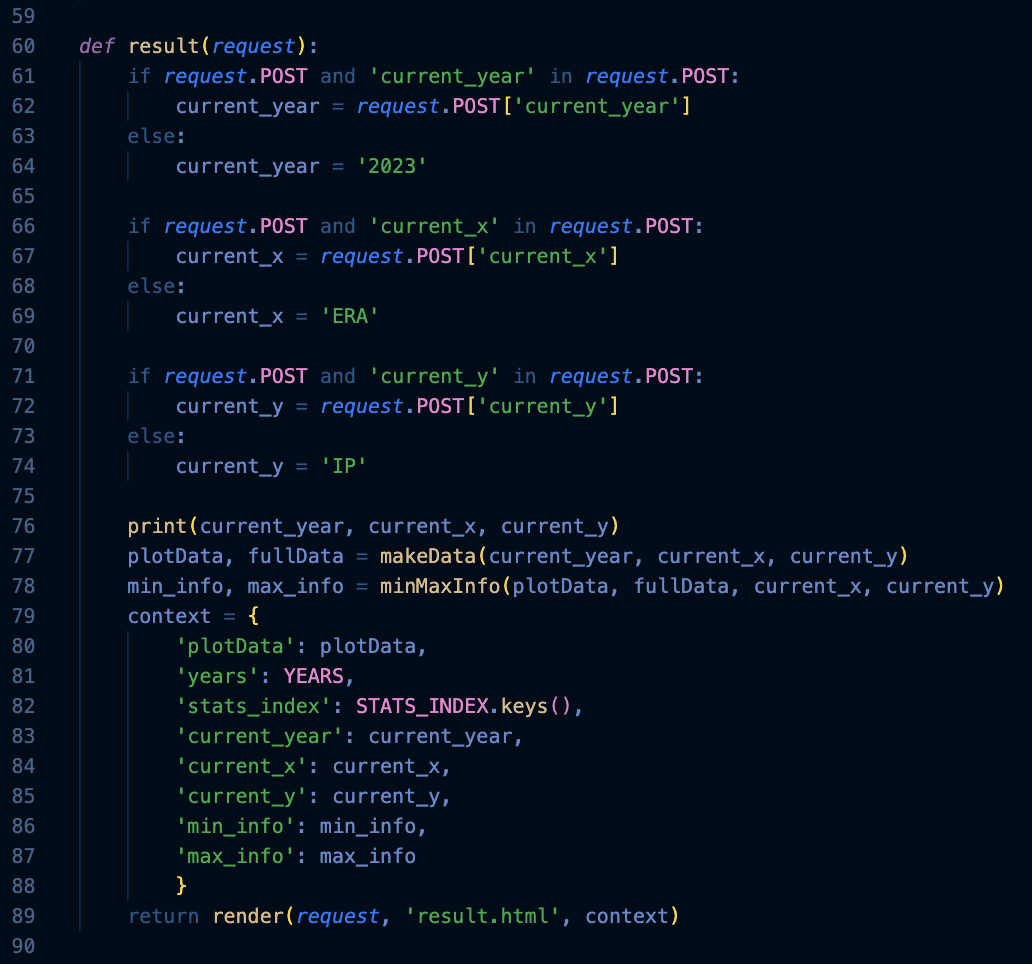
Ultimately, in the ‘result’ function, ‘request.POST’ is used once again to detect the user’s new input into the application, in categories such as year and x and y statistics value. Initially, without any input, the graph will display the data from the year 2023, the x-axis being ERA and the y-axis being IP. Moreover, the ‘makeData’ and ‘minMaxInfo’ functions will be executed here, with ‘makeData’ taking current_year, current_x, and current_y as the parameters, and ‘minMaxInfo taking in plotData, fullData, current_x, and current_y. Lastly, the data in the ‘context’ variable will be sent to ‘results.html’ where such data will be used to create a visual graph using the highcharts library.
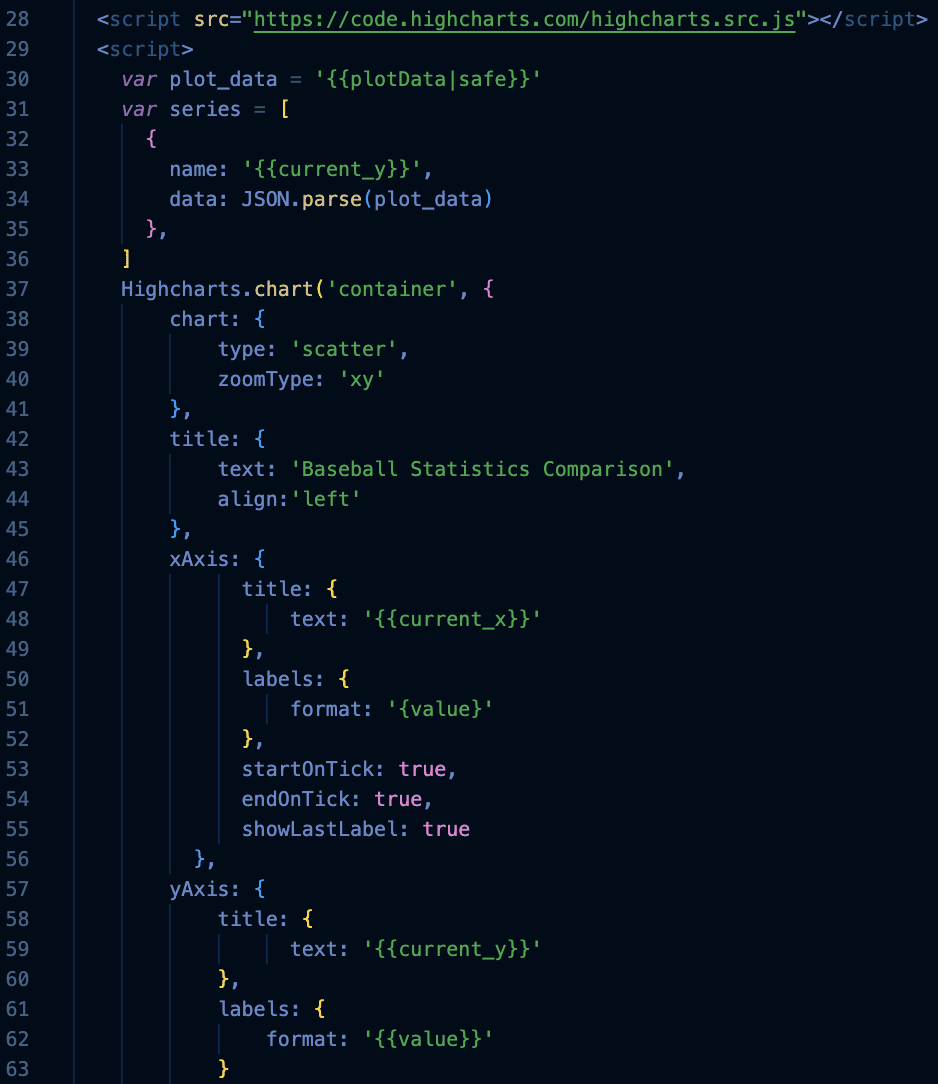
In ‘result.html’, I have incorporated the highcharts library to finally plot the preprocessed data sets onto a graph.
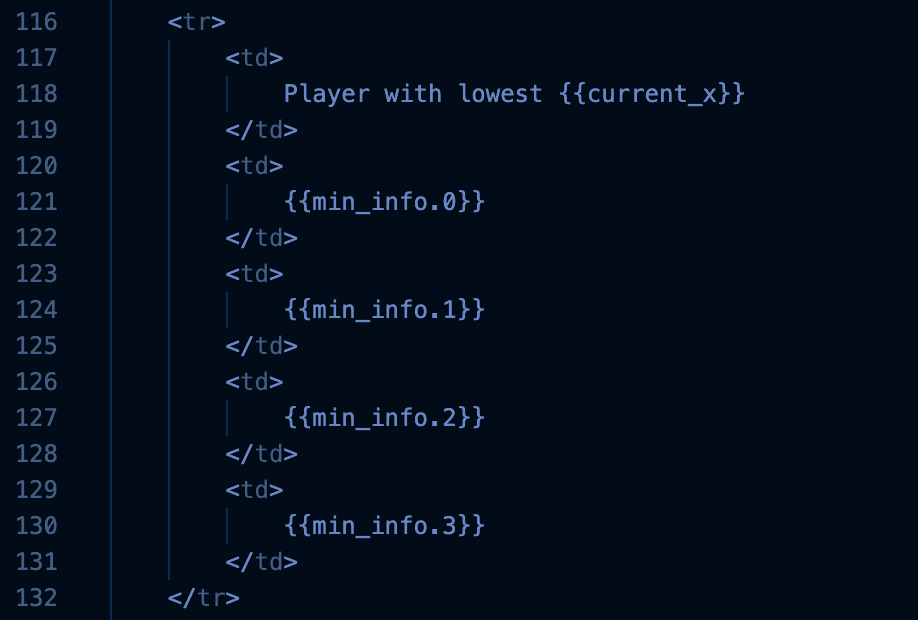
Moreover, I have created a table for the min and max statistics section. Using the <tr> and <td>, I have created a 5x3 table for display.
Comprehensively, my application was able to meet my initial desire, being able to create an application that successfully bridges the gap between intricate baseball statistics and Korean fans by offering an intuitive platform that predicts game outcomes and player performances using advanced machine learning, making the sport's analytical aspects more approachable for both seasoned and new enthusiasts. However, within my application, there were some improvements that could be made, such as the user being able to adjust the x and y-axis statistics in the machine learning prediction portion as well. But within my time frame and coding capabilities, I was able to achieve a well-rounded product that was both functional and user-friendly.
Final model:
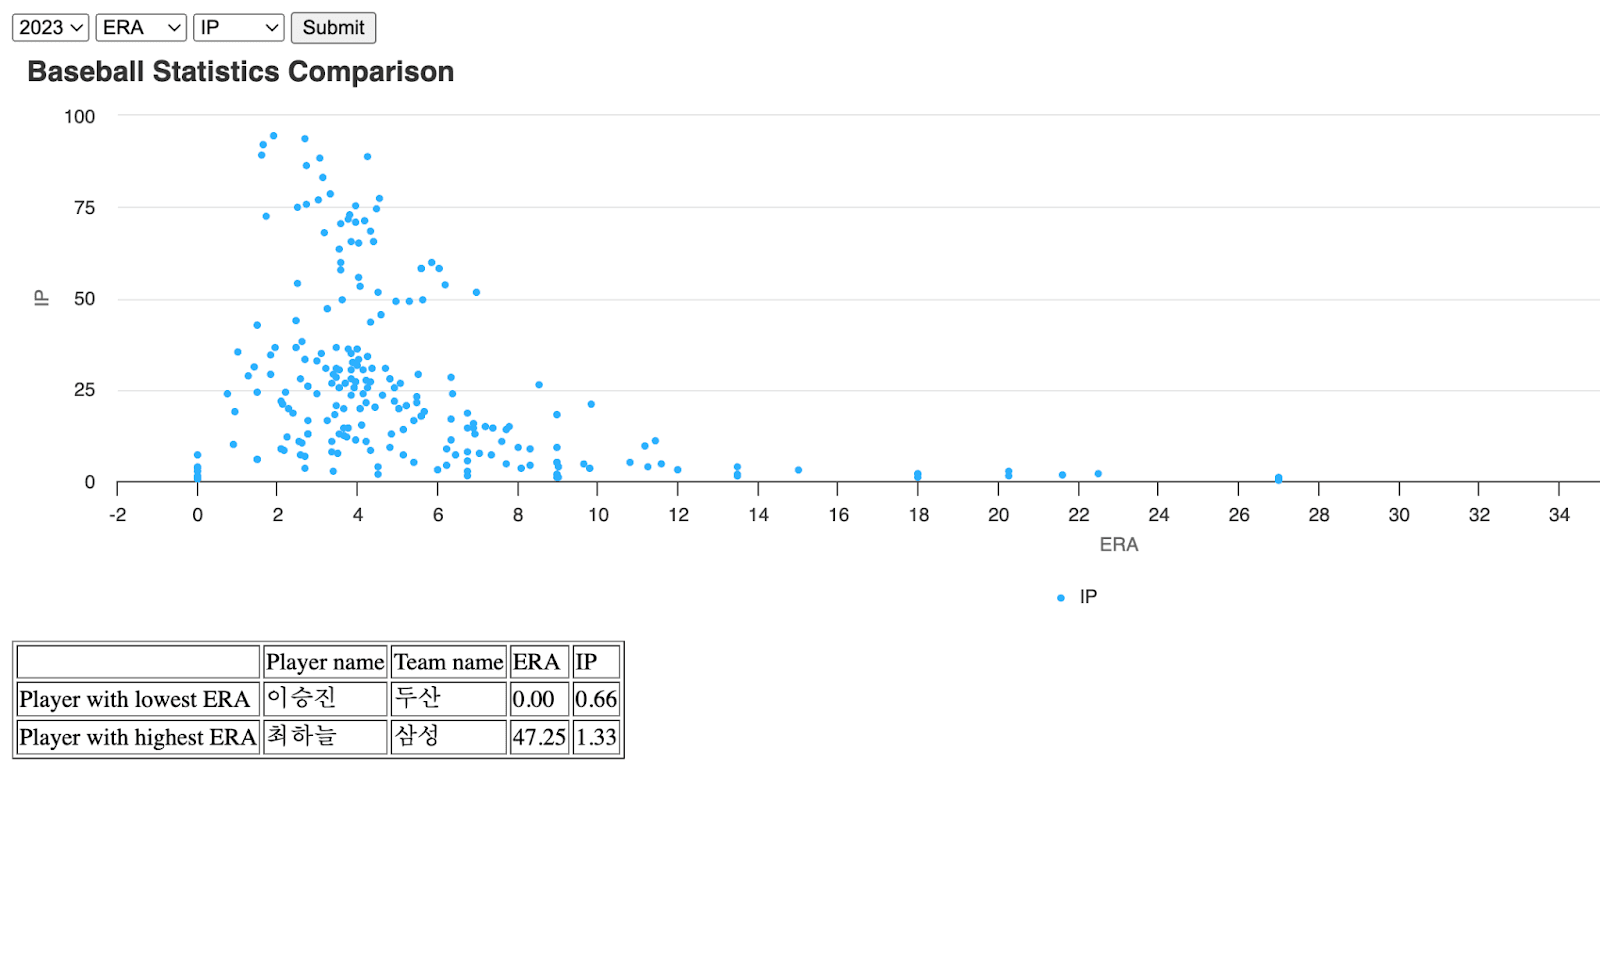
(Graphical Model)
UCLA Data Science 102
Read →
Baseball, Data, and the Future: A Passion for Statistics and the Game
Read →
Book Review: "Commitment" by Didier Drogba
Read →
Polarization in the Digital Age: A Concern for Modern Society
Read →
The Endless Fascination of History: A Journey of Discovery and Insight
Read →
Book Review: "Moneyball" by Michael Lewis
Read →
Legacy in Stone: The Architectural Journey of My Great Grandfather's Brother
Read →
Book Review: "Don't Make Me Think" by Steve Krug
Read →
A Surreal Journey: My Trip to Havasupai Indian Reservation with My Dad
Read →